About
ECGA (ecDNA gene analyzer) is a web-based application platform for ecDNA gene-oriented analysis in an efficient, reliable, interactive, and user-friendly way. Also, ECGA can be used as a resource to explore ecDNA genes in cancer.
The identification of ecDNA genes is based on whole genome sequencing (WGS) data of cancer cells. WGS data are acquired from two resources, one is CCLE and the other is NCBI's BioProject PRJNA338012. ecDNA genes were identified from the two data sets independently but with the same pipeline and then all findings were merged together to generate the ECGA's core ecDNA gene data set which is subsequently used to develop the dedicated analysis tools in ECGA.
Glossary
ecDNA
Extrachromosal circular DNA, ecDNA, is a type of circular DNA element characterized in cancer.
ecDNA gene
ecDNA gene represents the type of gene that is borne by ecDNA. Honestly speaking, there is no uniform name for such gene at present. They are also referred to as ecDNA-carrying gene, ecDNA-borne gene, cargo gene, ecDNA containing gene, ecDNA-encoding gene, etc. in literatures.
ecDNA gene score
For each ecDNA gene, we assign a score to describe the tendency of the gene to be a true ecDNA gene. An ecDNA gene socre (S) is calculated as
S = (G ∩ E) / G
where G is a candidate gene, E is an ecDNA, ∩ denotes intersection. S is explained as the proportion of length of a gene intersecting with an ecDNA.
ecDNA hits
ecDNA hits represents the number of ecDNAs by which a gene is carried. For example, if a gene has intersections with 10 ecDNAs, then the ecDNA hits of this gene is 10.
DE, DEG, DE ecDNA gene
The three terms represent differential expression, differentially expressed gene, and differentially expressed ecDNA gene, respectively.
ecDNA gene signature
A signature is composed of a set of ecDNA genes identified via machine learning-based techniques. It can be used for diagnosis, prognosis, drug response prediction, and so on.
Tools
Venn analysis ▼
Venn analysis is a simple but useful way to find out whether there are any ecDNA genes in a candidate gene list.
Steps for venn analysis
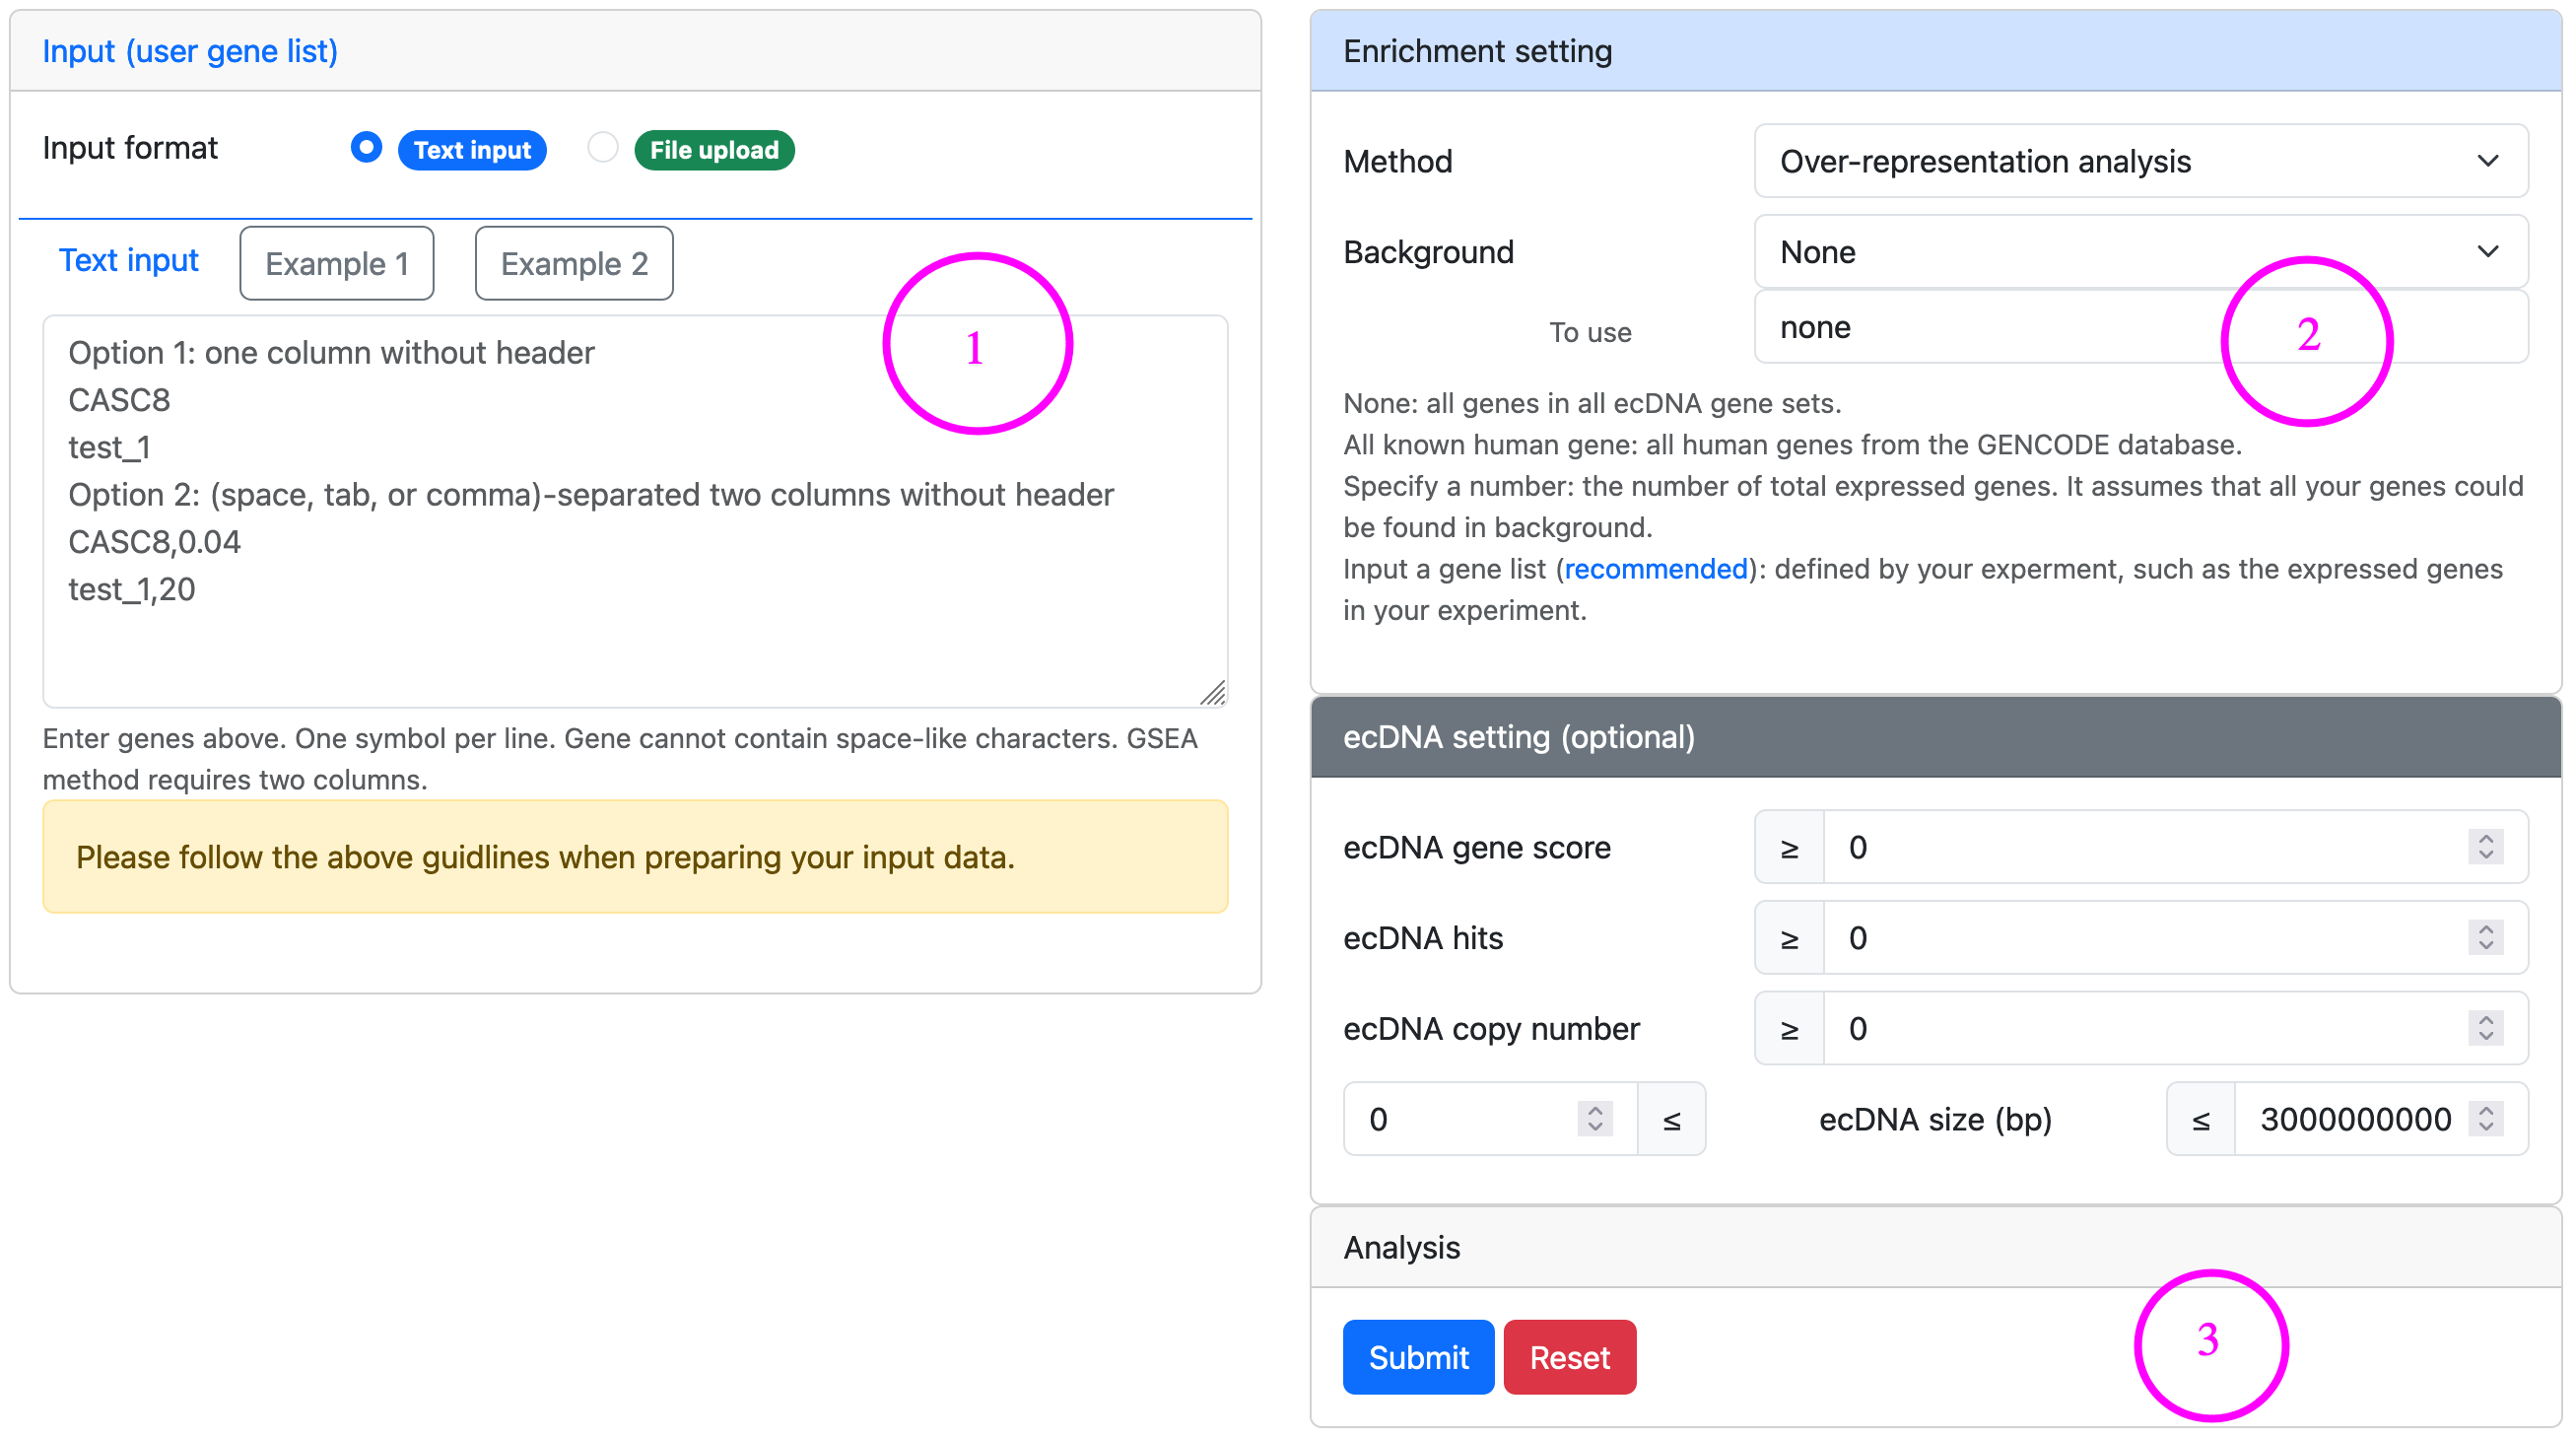
- Input a gene list either in the text area or uploading a file.
- Use optional ecDNA setting to filter ecDNA genes by ecDNA features. For the definition of ecDNA gene score and ecDNA hits, please refer to Glossary.
- Launch analysis and check the results.

Enrichment analysis ▼
Enrichment analysis is a computational method that determines whether a predefined set of ecDNA genes shows statistically significance in a candidate gene list derived from the comparison between two biological states (e.g., phenotypes).
Steps for enrichment analysis
- Input a gene list either in the text area or uploading a file. For GSEA-based analysis, the input data should be a pre-ranked list which has two columns, with the first showing gene symbols and the second showing ranking score.
- Set enrichment settings, such as method, background, permutations, etc. Also, optional ecDNA settings can be used to filter ecDNA genes by ecDNA features. For the definition of ecDNA gene score and ecDNA hits, please refer to Glossary.
- Launch analysis and check the results.
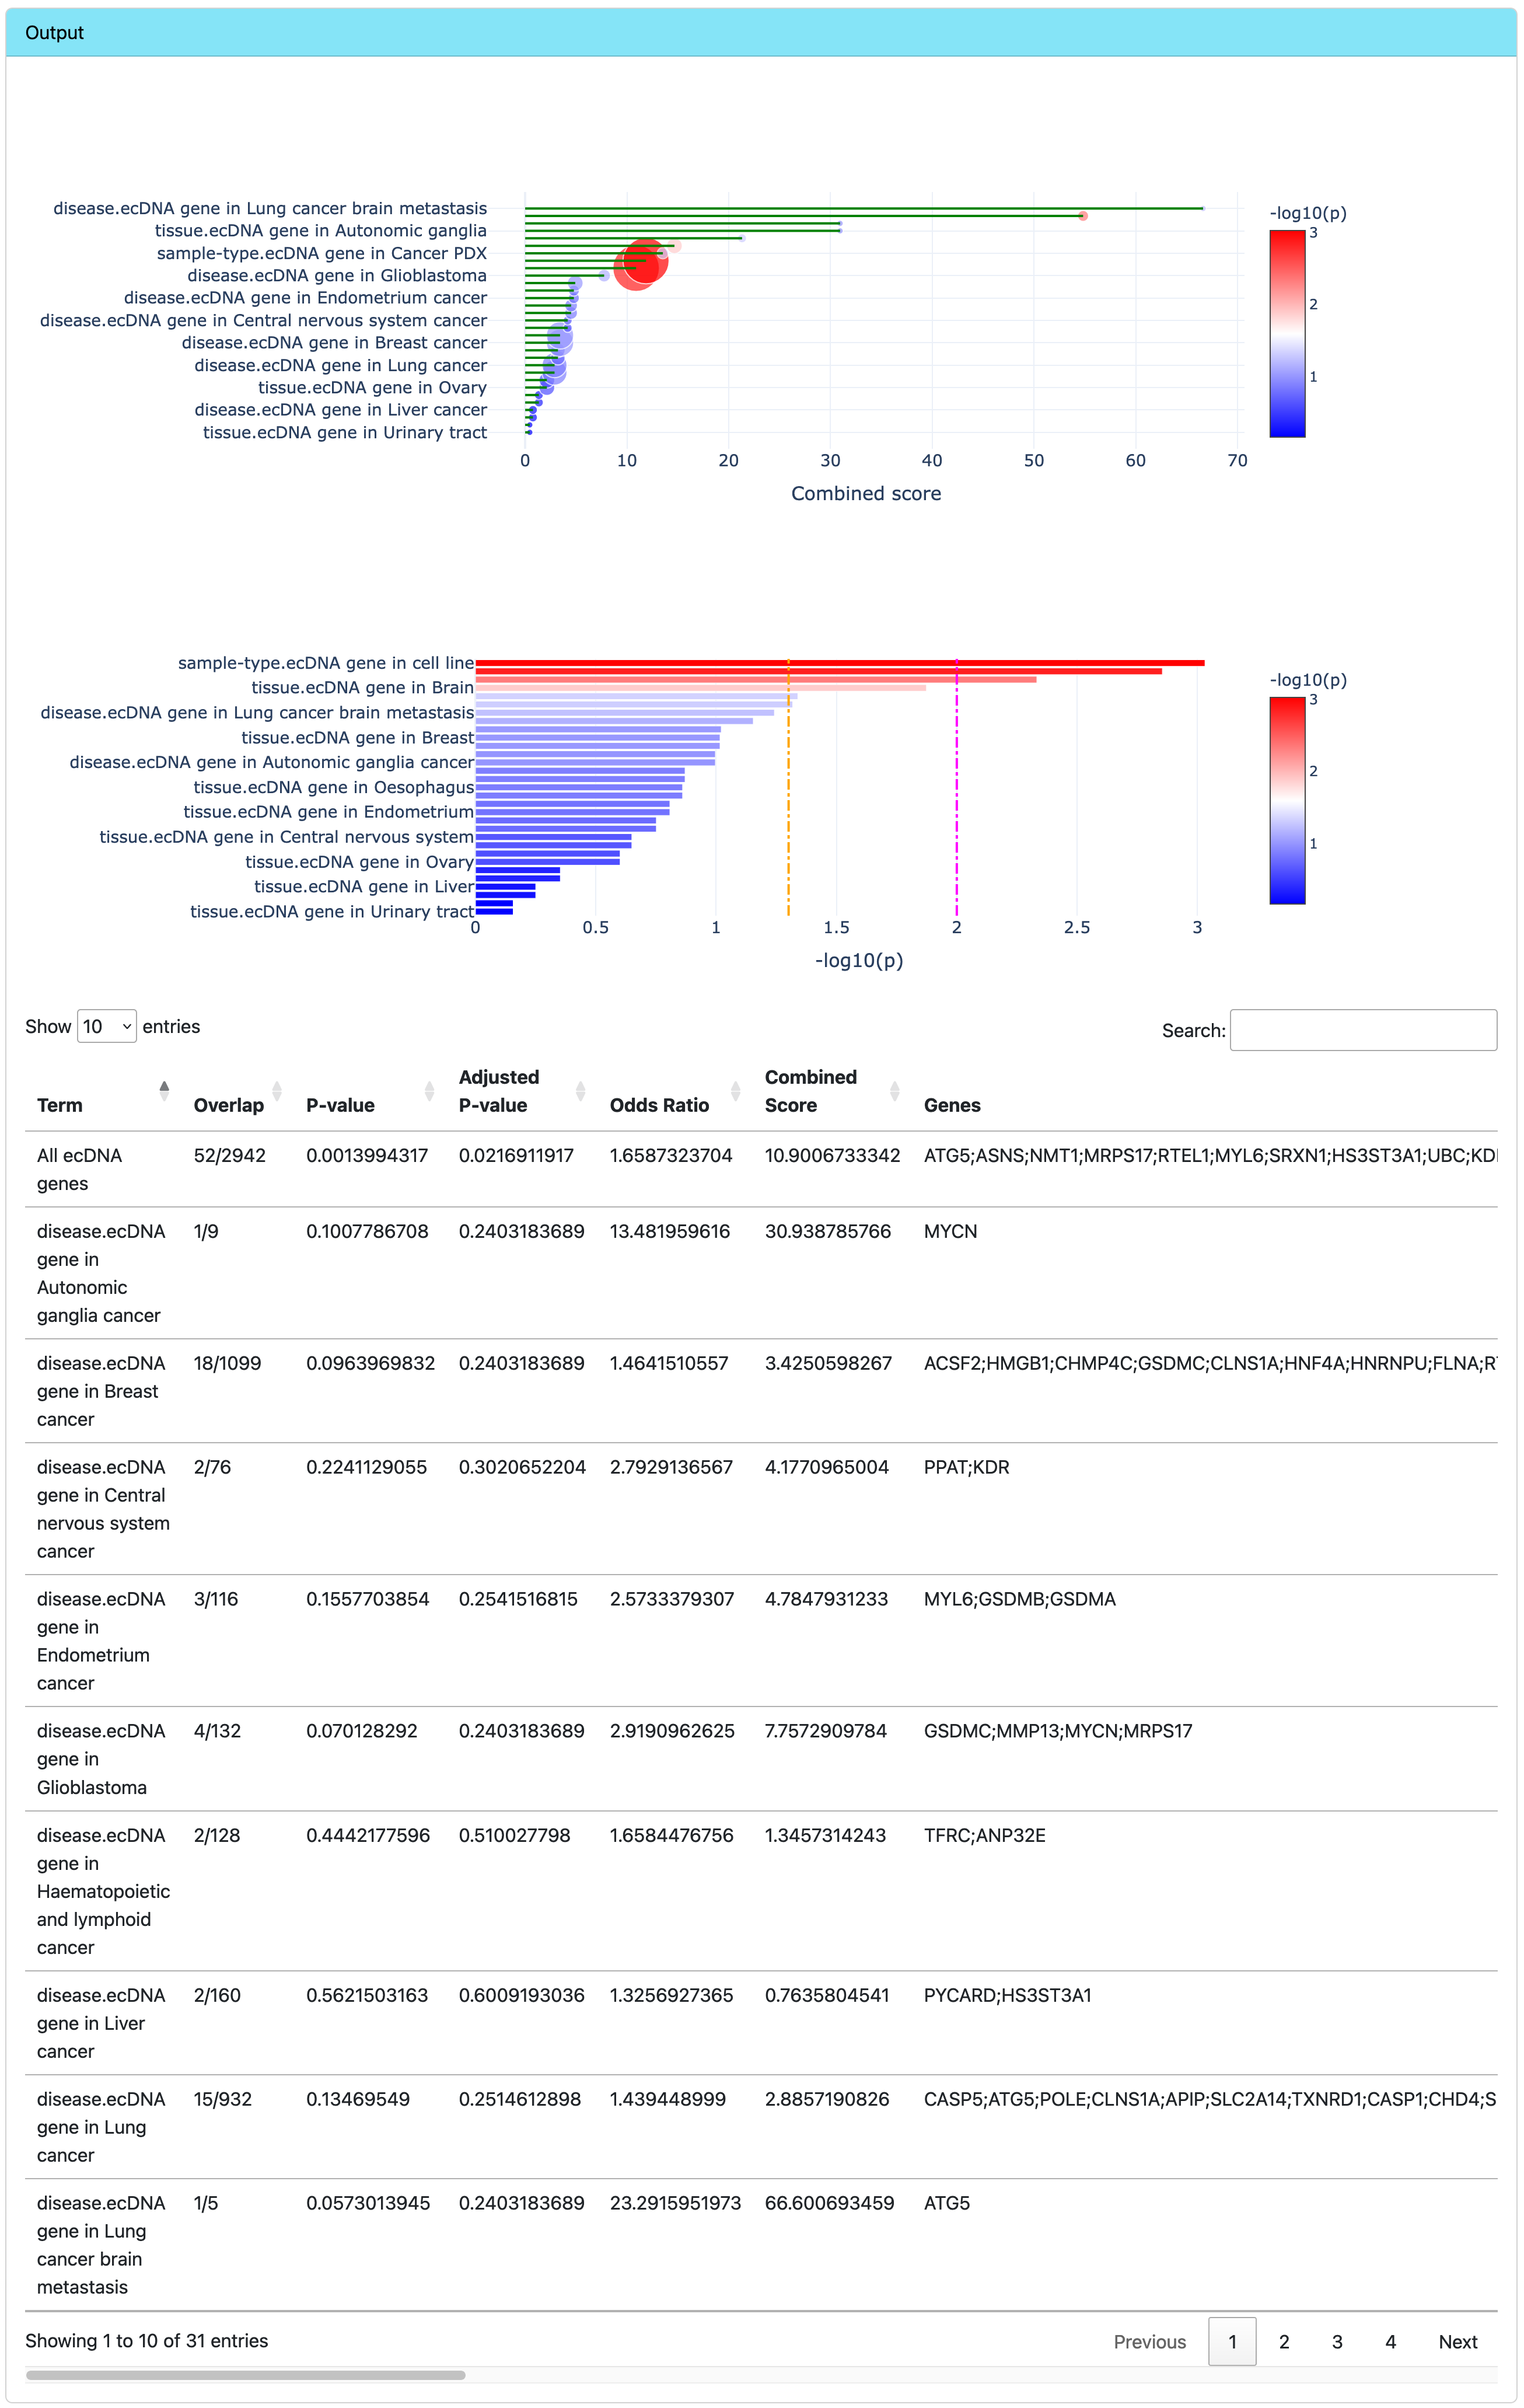
Browse ORA results
The output contains two interactive plots and a data table.
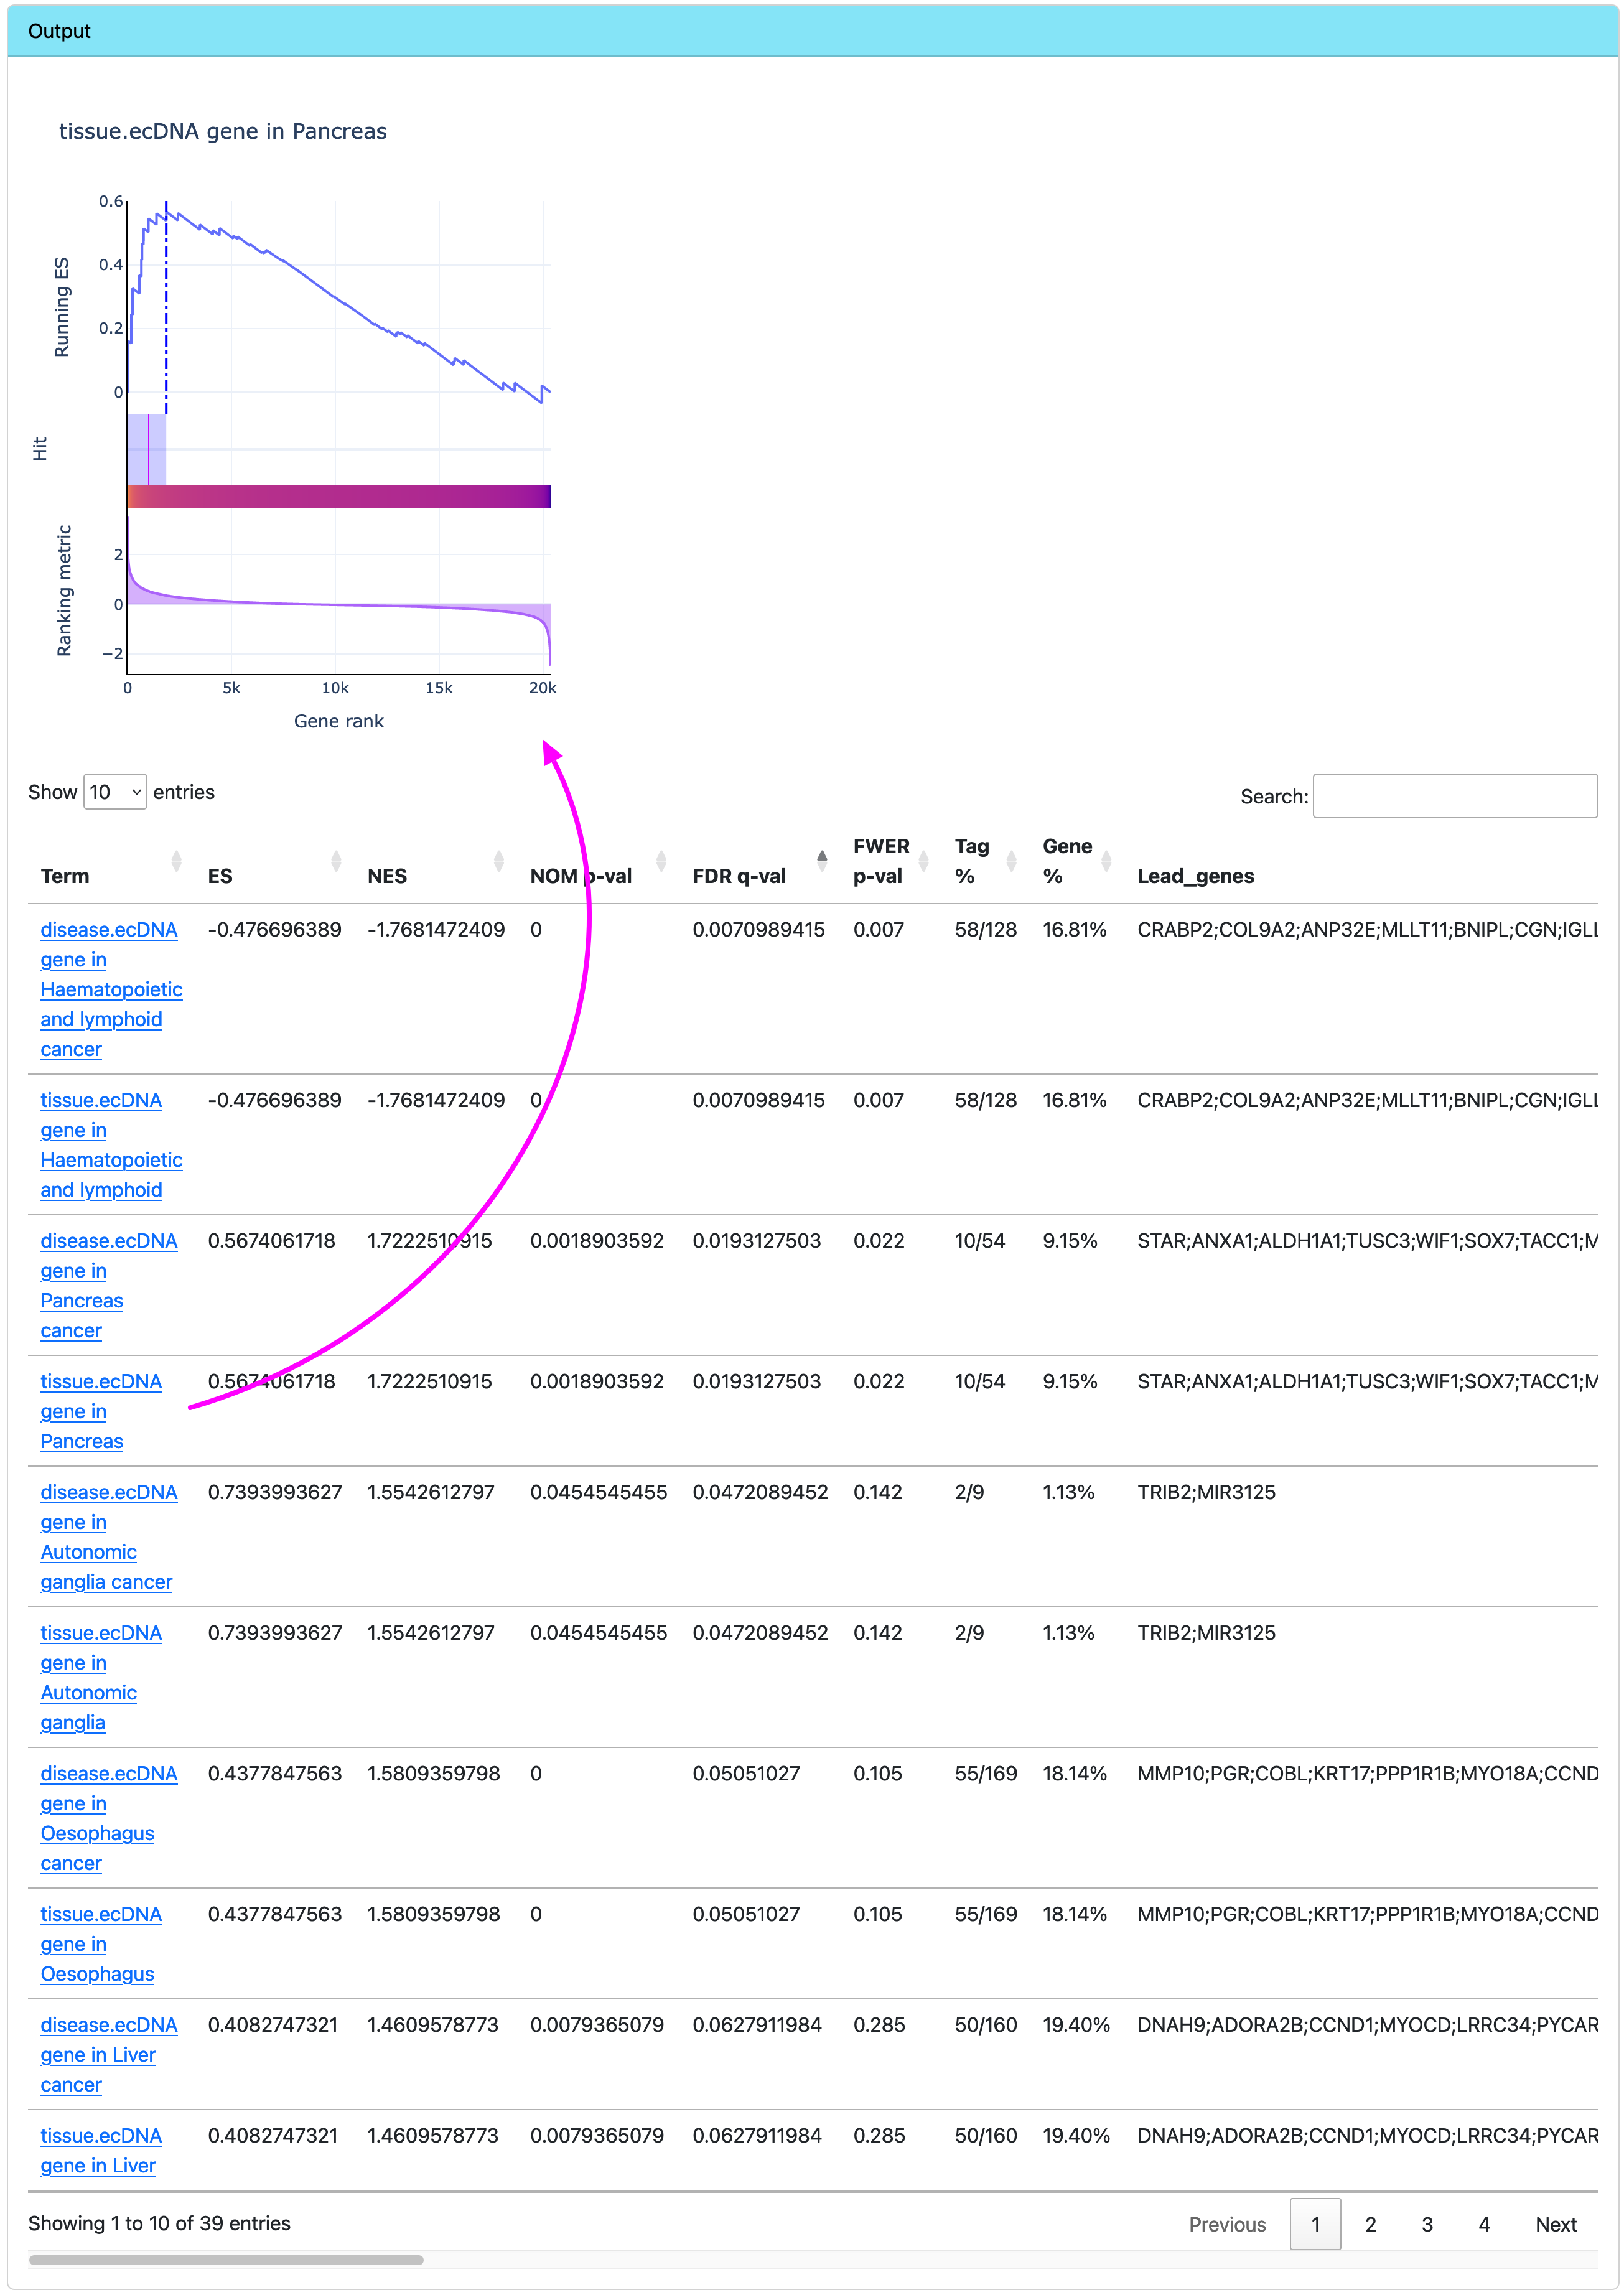
Browse GSEA results
The output is a data table. Clicking on a term in the first column will draw an interactive plot for it.
Target discovery ▼
Target discovery identifies ecDNA genes as targets that are highly expressed in input samples compared to their expression levels in normal human cell lines and tissues. Target discovery uses the service provided by TargetRanger.
Steps for target discovery
- Upload RNA-seq count data in csv/tsv format.
- Set file format and the background to compare. Optional ecDNA settings can be used to filter ecDNA genes by ecDNA features. For the definition of ecDNA gene score and ecDNA hits, please refer to Glossary.
- Launch analysis and check the results.

DE analysis ▼
Differential expression (DE) analysis identifies differentially expressed ecDNA genes between two biological conditions.
Steps for differential expression analysis
- Upload a gene expression matrix in csv/tsv format, or select a GDC TCGA data set.
- Set data processing parameters and differential expression thresholds. Optional ecDNA settings can be used to filter ecDNA genes by ecDNA features. For the definition of ecDNA gene score and ecDNA hits, please refer to Glossary.
- Launch analysis and check the results.
- Fetch results manually or retrieve history results if required.

Signature discovery ▼
Signature discovery discovers an ecDNA gene signature via artificial intelligent techniques. The found signature is basically a set of ecDNA genes whose expression levels can be used to classify samples using machine learning models.
The input and setting steps for signature discovery is the same as DE analysis. In fact, signature discovery fundamentally extends DE analysis with a machine learning step. You can retrieve the DE results of a completed signature discovery analysis in the DE analysis tool by inputting the file ID from signature discovery.
As can be seen from the diagram below, the output of signature discovery is the identified signature and evaluations of this signature across a variety of classifiers.
If the discovered signature and the trained model need to be further evaluated on an unseen data set, an optional signature validation tool is offered at the bottom of the page.

Performance
| TCGA-THYM | TCGA-CESC | TCGA-COAD | |
|---|---|---|---|
| # Genes | 60660 | 60660 | 60660 |
| # Samples | 123 | 310 | 522 |
| Setting | Tissue: Thyroid | Tissue: Cervix | Tissue: Colon/Rectum |
| Processing time | 2'13 | 2'47 | 3'17 |
| AUC | 0.86 | 1 | 0.99 |
| ACC | 0.97 | 0.99 | 0.99 |
Signature validation (optional) ▼
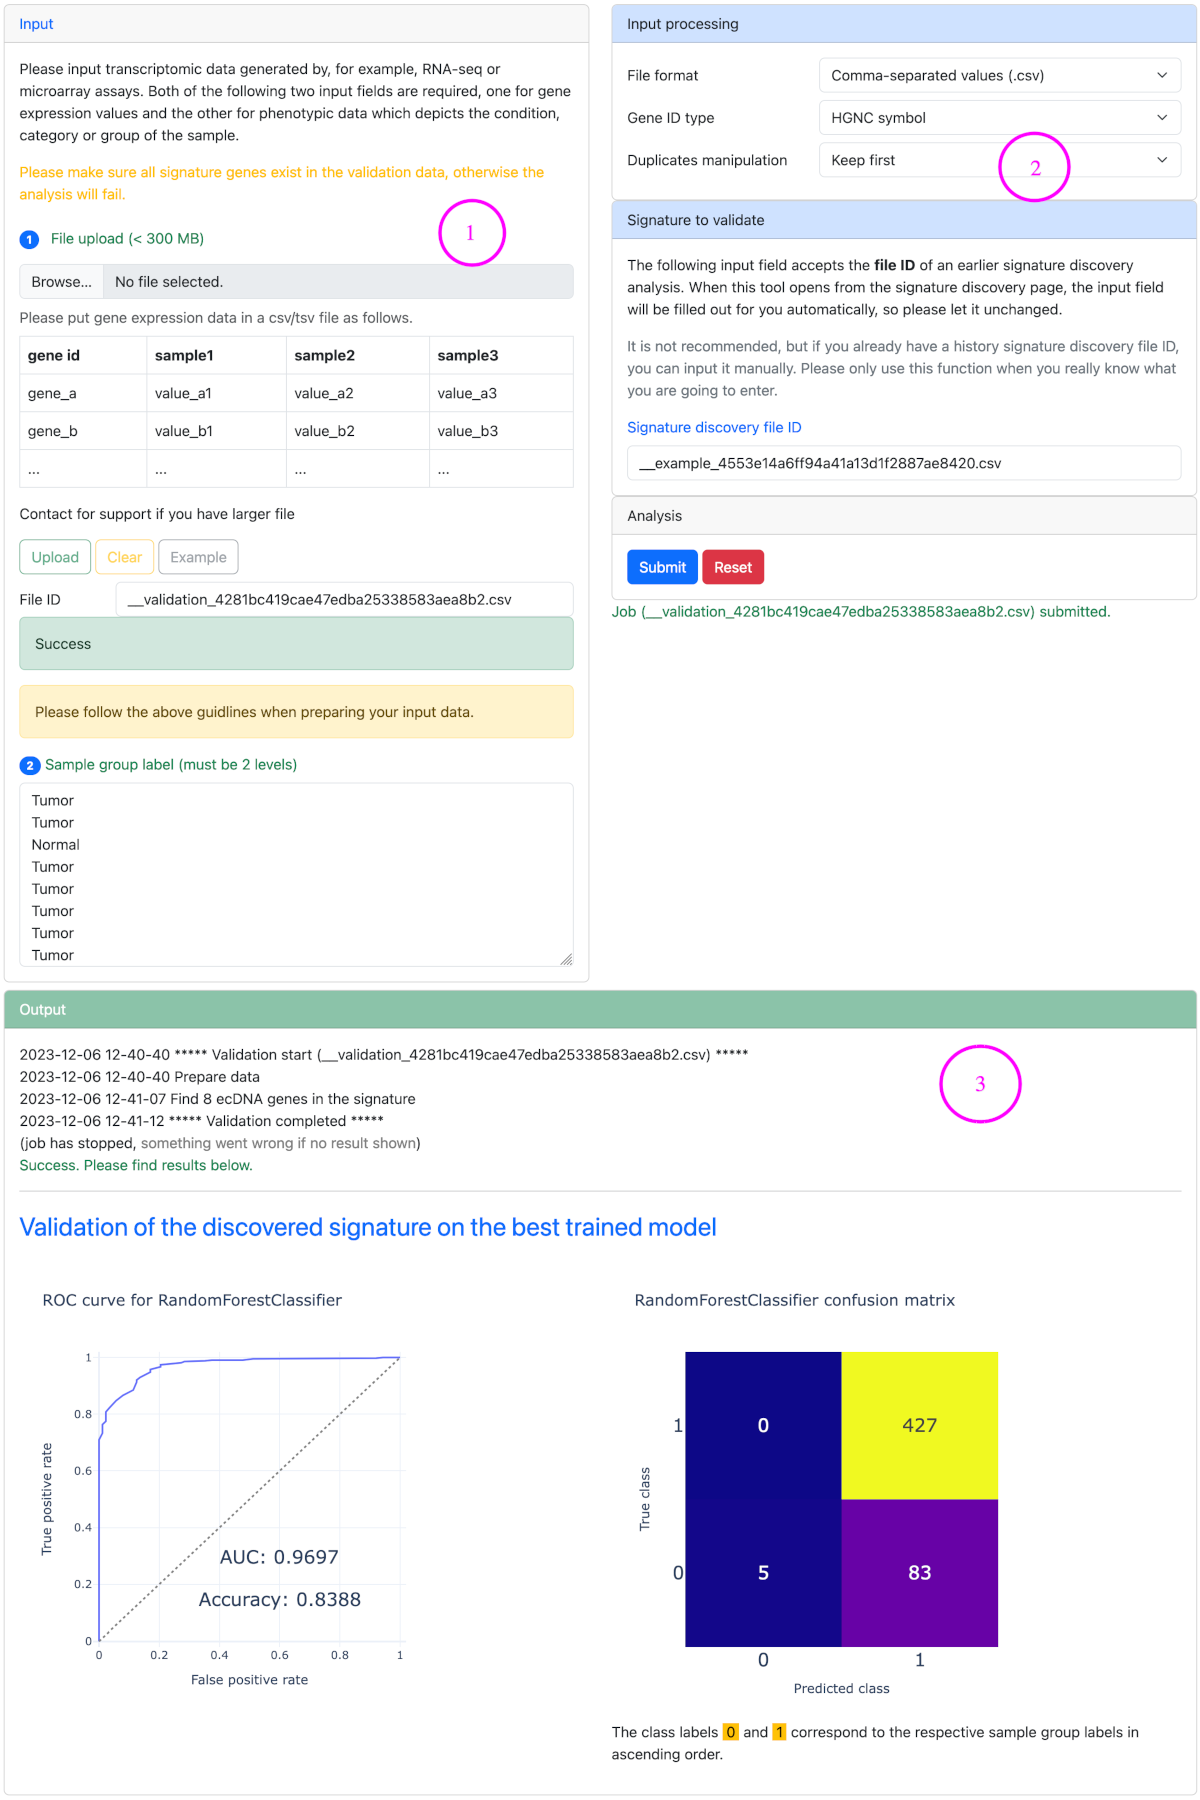
Signature validation can be implemented following the completion of a signature discovery analysis. Signature validation depends on the results of signature discovery. So please open it from the signature discovery page.
Steps for signature validation
- Upload a gene expression matrix in csv/tsv format.
- Set data processing parameters and the signature to validate.
- Launch analysis and check the results.
Example data ▼
These data are used for example demonstration throughout this web server:
- OV-TCGA-GTEx: Gene expression (log2-transformed normalized count) and phenotype of ovarian cancer of the UCSC Xena's TCGA TARGET GTEx cohort. TARGET and non-OV samples were removed. TCGA samples were labeled as tumor, whilst GTEx samples were labeled as normal. The data for downstream analysis includes 515 samples and 58581 genes.
- OV-2009: Gene expression (microarray) and phenotype of ovarian cancer of the UCSC Xena's Ovarian Cancer (Etemadmoghadam 2009) cohort. Non-ovary samples were removed. Samples without grade or stage information were also removed. Since this data set is not tumor-normal paired, samples of grade 1 and type LMP (low-malignant potential) were labeled as normal and others were labeled as tumor. The data for downstream analysis includes 237 samples and 20373 genes.
- ICGC-OV-AU: RNA-seq count data of the OV-AU ovarian cancer project was downloaded from ICGC. Three tumor samples (SP102161, SP102133, SP102143) were then selected to generate the example data set (35450 genes by 3 samples).
Next, limma was used for differential expression analysis. Differentially expressed genes (DEGs) were selected with |log2(fold change)| > 1 and p < 0.05. Ranking gene list was ranked by log2(fold change), where fold change is calculated as tumor divided by normal.
Venn analysis example data: OV-2009 DEGs (~ 1.5 MB)
Enrichment analysis example data: OV-2009 DEGs (~ 1.5 MB)
Target discovery example data: ICGC-OV-AU RNA-seq count matrix (~ 687 KB)
DE analysis example data OV-2009 expression matrix (~ 90 MB)
Signature discovery example data: OV-2009 expression matrix (~ 90 MB)
Signature validation example data: OV-TCGA-GTEx expression matrix (~ 138 MB)
Resource
ecDNA gene
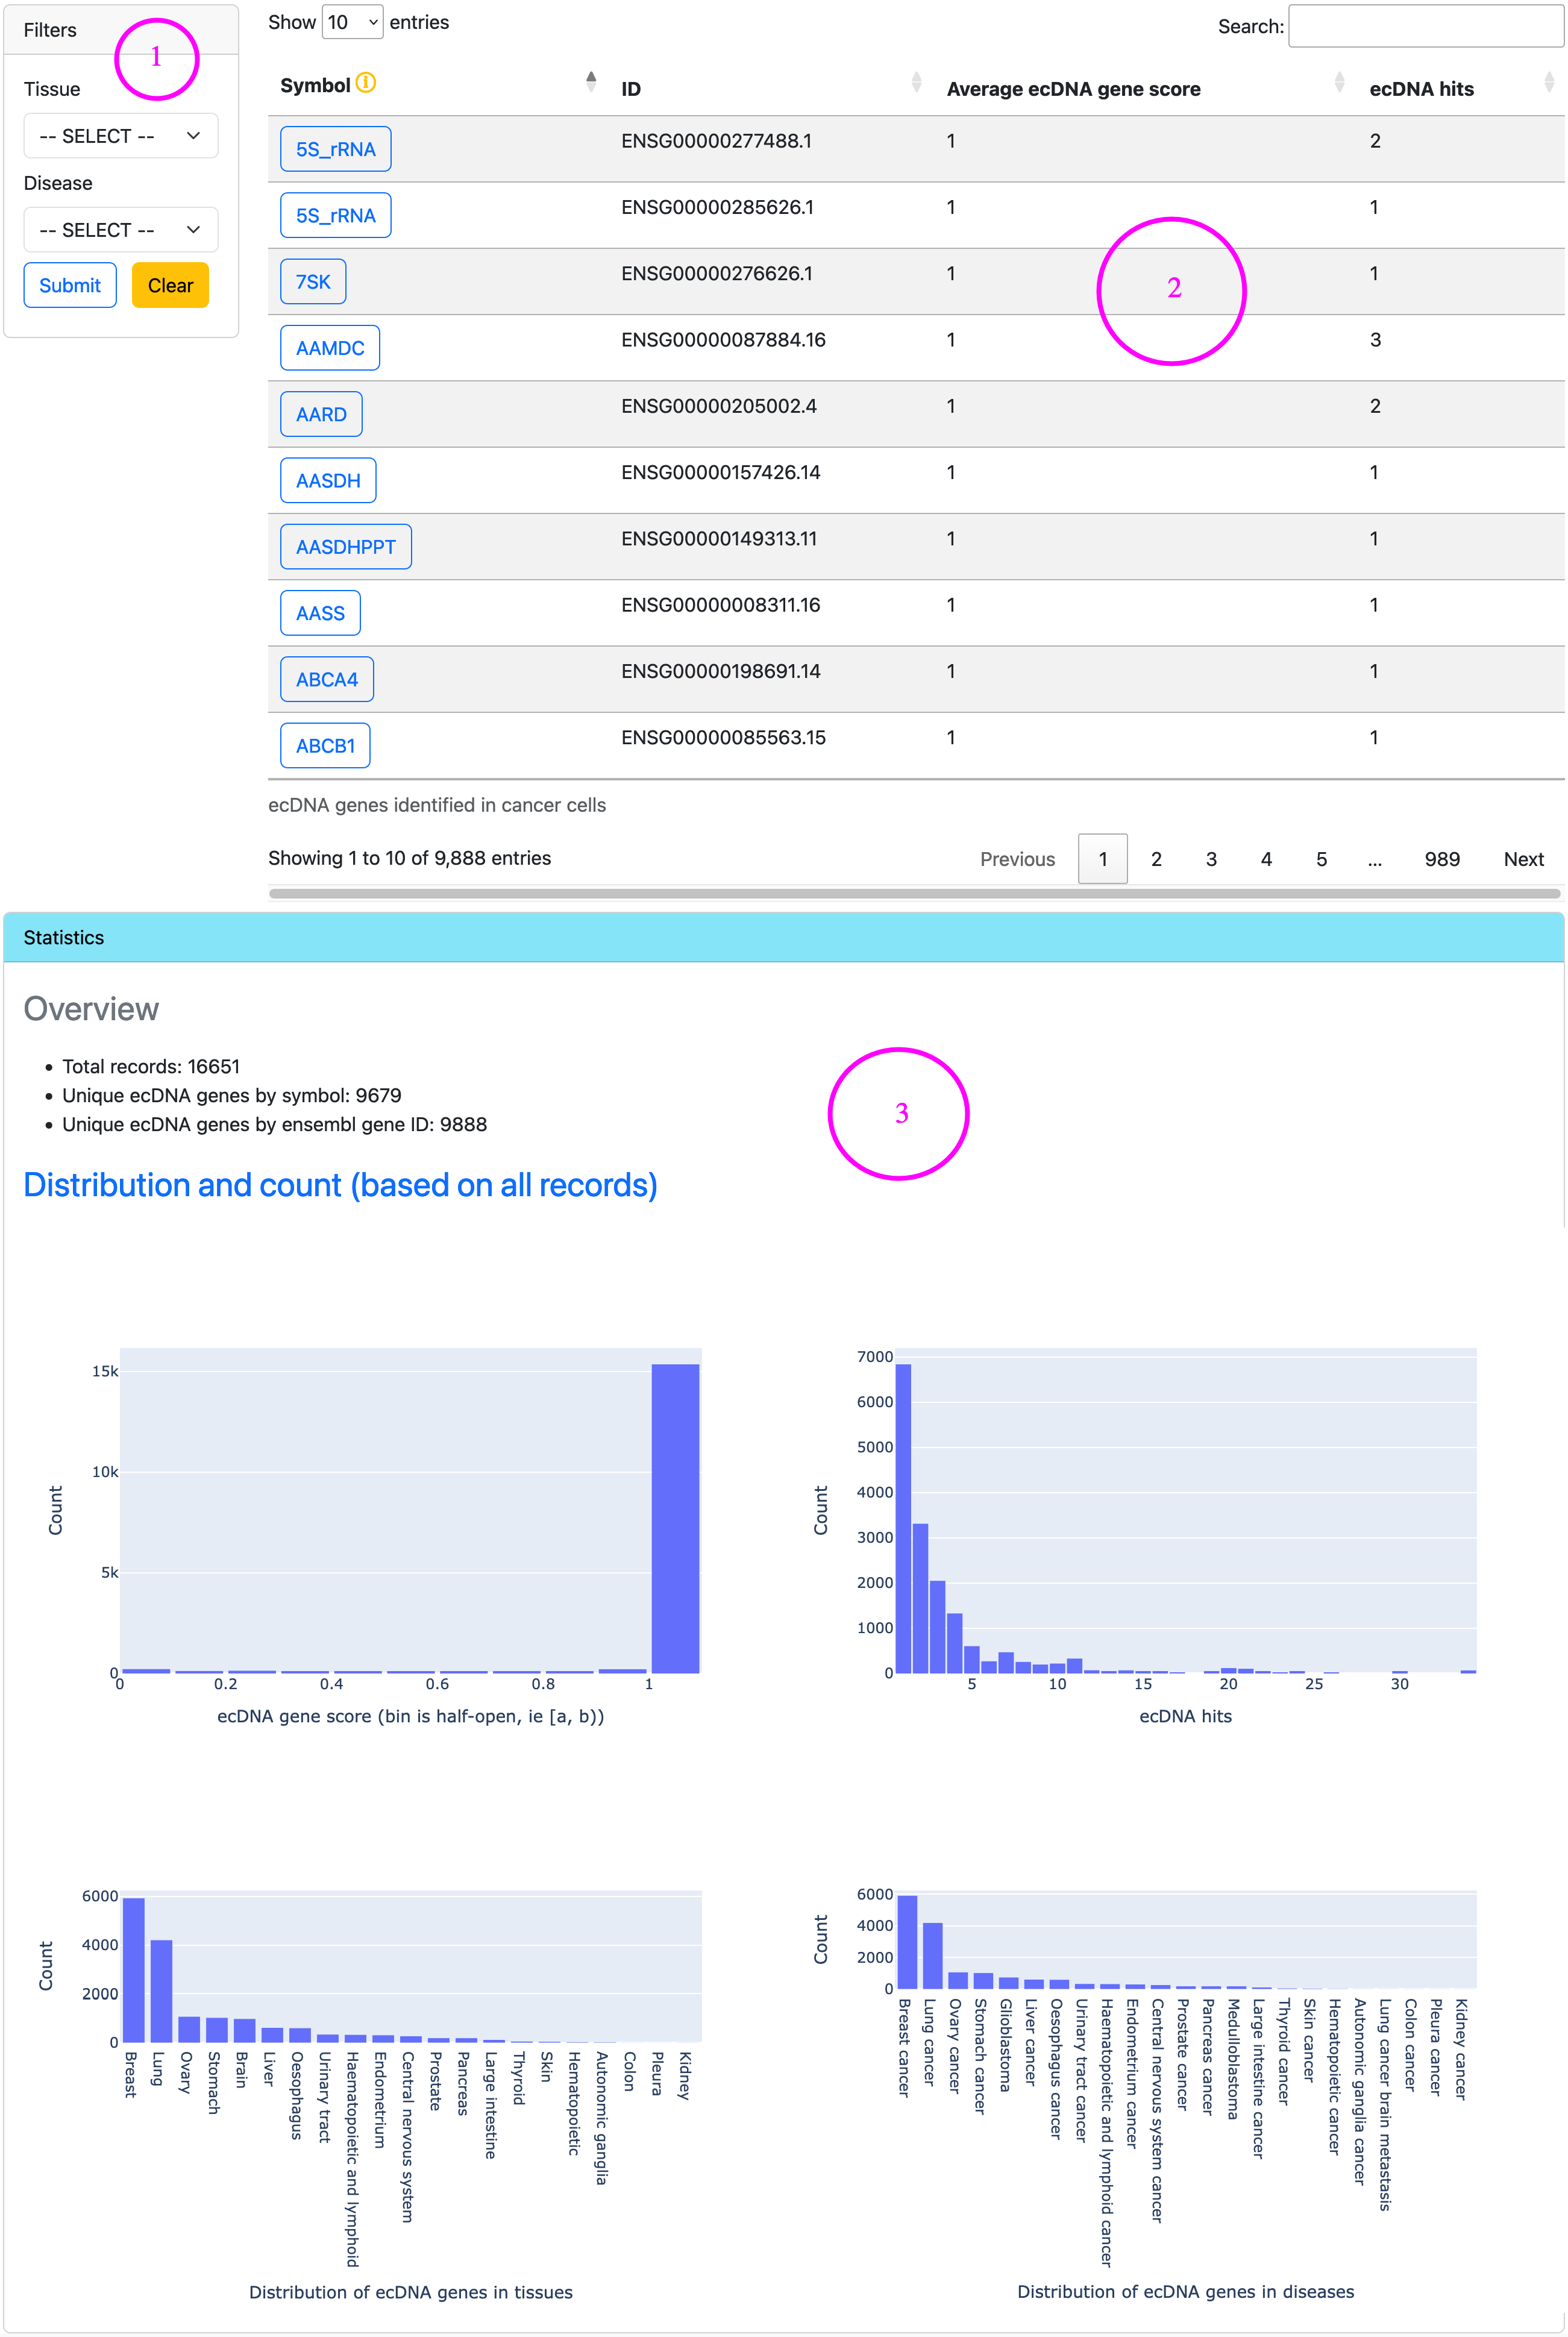
On the resource page that displays ecDNA genes in cancer, panel 1 provides filters, panel 2 lists ecDNA genes in a table, and panel 3 shows statistics of ecDNA genes.
Feedback
For inquiries or suggestions, please send an email to adminzhounan.org. We welcome all messages regarding to this project.
Contact
| Name | Affiliation | |
|---|---|---|
| Xiaoqing Yuan | Sun Yat-Sen Memorial Hospital, Sun Yat-Sen University | yuanxq7mail.sysu.edu.cn |
| Li Peng | Sun Yat-Sen Memorial Hospital, Sun Yat-Sen University | pengli9mail.sysu.edu.cn |
| Nan Zhou | The Affiliated Brain Hospital of Guangzhou Medical University | adminzhounan.org |